Skip to content

Hi, I'm Chris.

Maps, dashboards, and production AI.

Over a decade of production software built with the customer in the room, for humanitarian programs, federal agencies, regulated fintech, and my own shipped products.

I scope problems that arrive unspecified, build the system end to end, and instrument it so the customer can see whether it worked. Most of what is linked here is public and still online.

CL

Open to forward deployed roles

Talking to teams building applied AI, technical field organizations, and anyone whose hardest deployments happen inside someone else's systems.

Roles
Forward Deployed Engineer, Solutions Architect, Applied AI
Based in
Greater Boston, open to travel
Domains
Fintech, federal, humanitarian, agriculture
Currently
Sr. Principal Engineer, Mission Lane
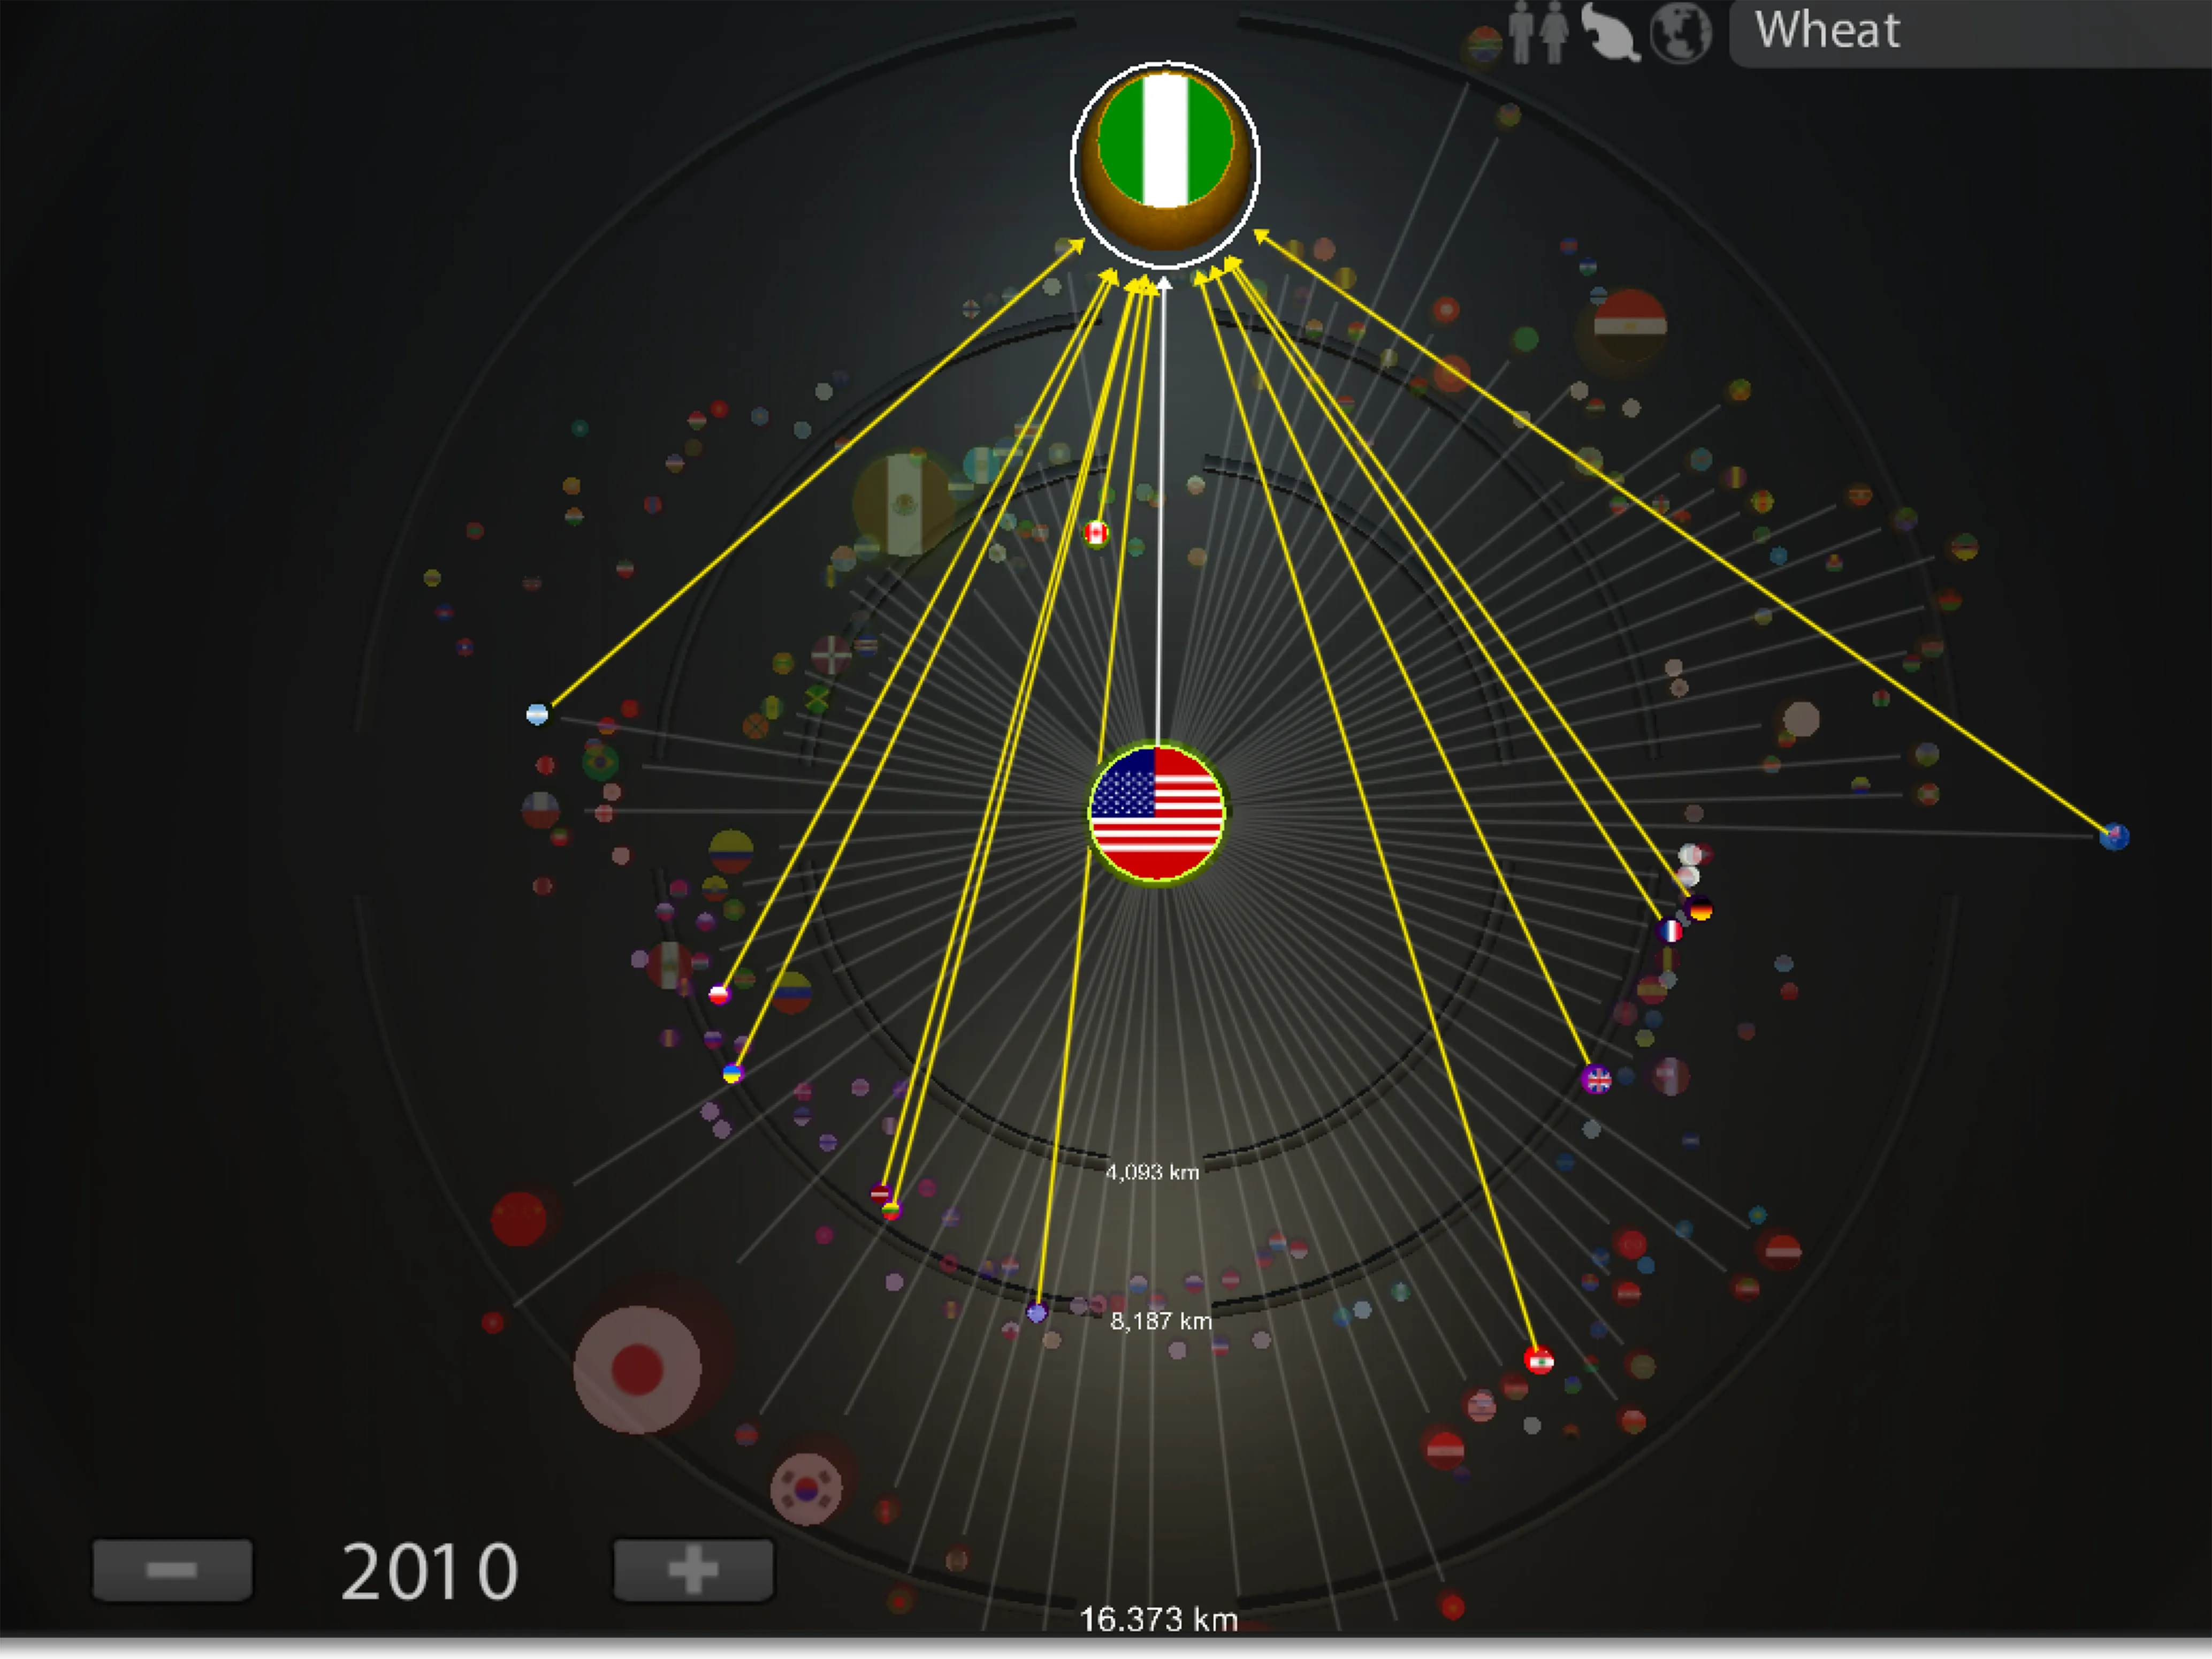
Trade dashboard focused on U.S. wheat exports and market movement.

How a deployment runs, on a system you can open.

The four phases below are how I work. Each one is written against PlateQuest, a shipped iOS product I own end to end, so none of it is hypothetical.

  1. 01 Discover

    Write the gate before building anything

    Four numbers agreed up front: 95% top-one precision at confidence 0.9 or above, 30% coverage, sub-100ms inference on the Neural Engine, under 10MB bundled. Precision leads because a confident wrong answer costs a player a first find, and paying for a cloud call is the cheaper mistake.

  2. 02 Prototype

    Spike the risky assumption, then measure it

    Two standalone spikes ran before any architecture was committed. Nearest-anchor retrieval on Vision feature prints reached 52.2% top-one with no training step at all, against a production softmax baseline of 40%. Text recognition read the state banner on 84.1% of real captures for roughly 40ms.

  3. 03 Productionize

    Tier the inference, keep every path reversible

    The on-device classifier answers what clears the gate, anything below it falls through to a cloud vision model, and what the cloud cannot settle lands in a human review queue. New architectures run in shadow mode behind a remote flag, writing telemetry but touching no user-visible decision, before they take the default path.

  4. 04 Instrument

    Publish the result, including when it fails

    Telemetry records every cloud prediction, auto-approval, and admin correction, and an internal dashboard reads precision, coverage, and a confusion matrix off live traffic. The retrieval successor scored 64.6% against its 70% gate on a 48-capture holdout and did not ship.

The full evaluation is published, including the run that failed: 6 registered policies against the 70% gate, the precision and coverage sweep, the 17 misses sorted by cause, and per-class accuracy with the sample sizes left in.

Read the eval results

Selected work.

Eight products for a USAID program, UNHCR, and civic, trade, and agriculture audiences. Six are still online, several rebuilt years later off their legacy stacks.

Trade dashboard focused on U.S. wheat exports and market movement.

TradeNet Wheat Exports

A market-oriented dashboard for understanding export behavior and shipment movement through concise comparative views.

Category
Trade intelligence
Role
Dashboard design, data visualization engineering
Outcome
Improved visibility into trade movement patterns through concise comparative dashboards for market-focused review.
  • Dashboard
  • Analytics
  • D3
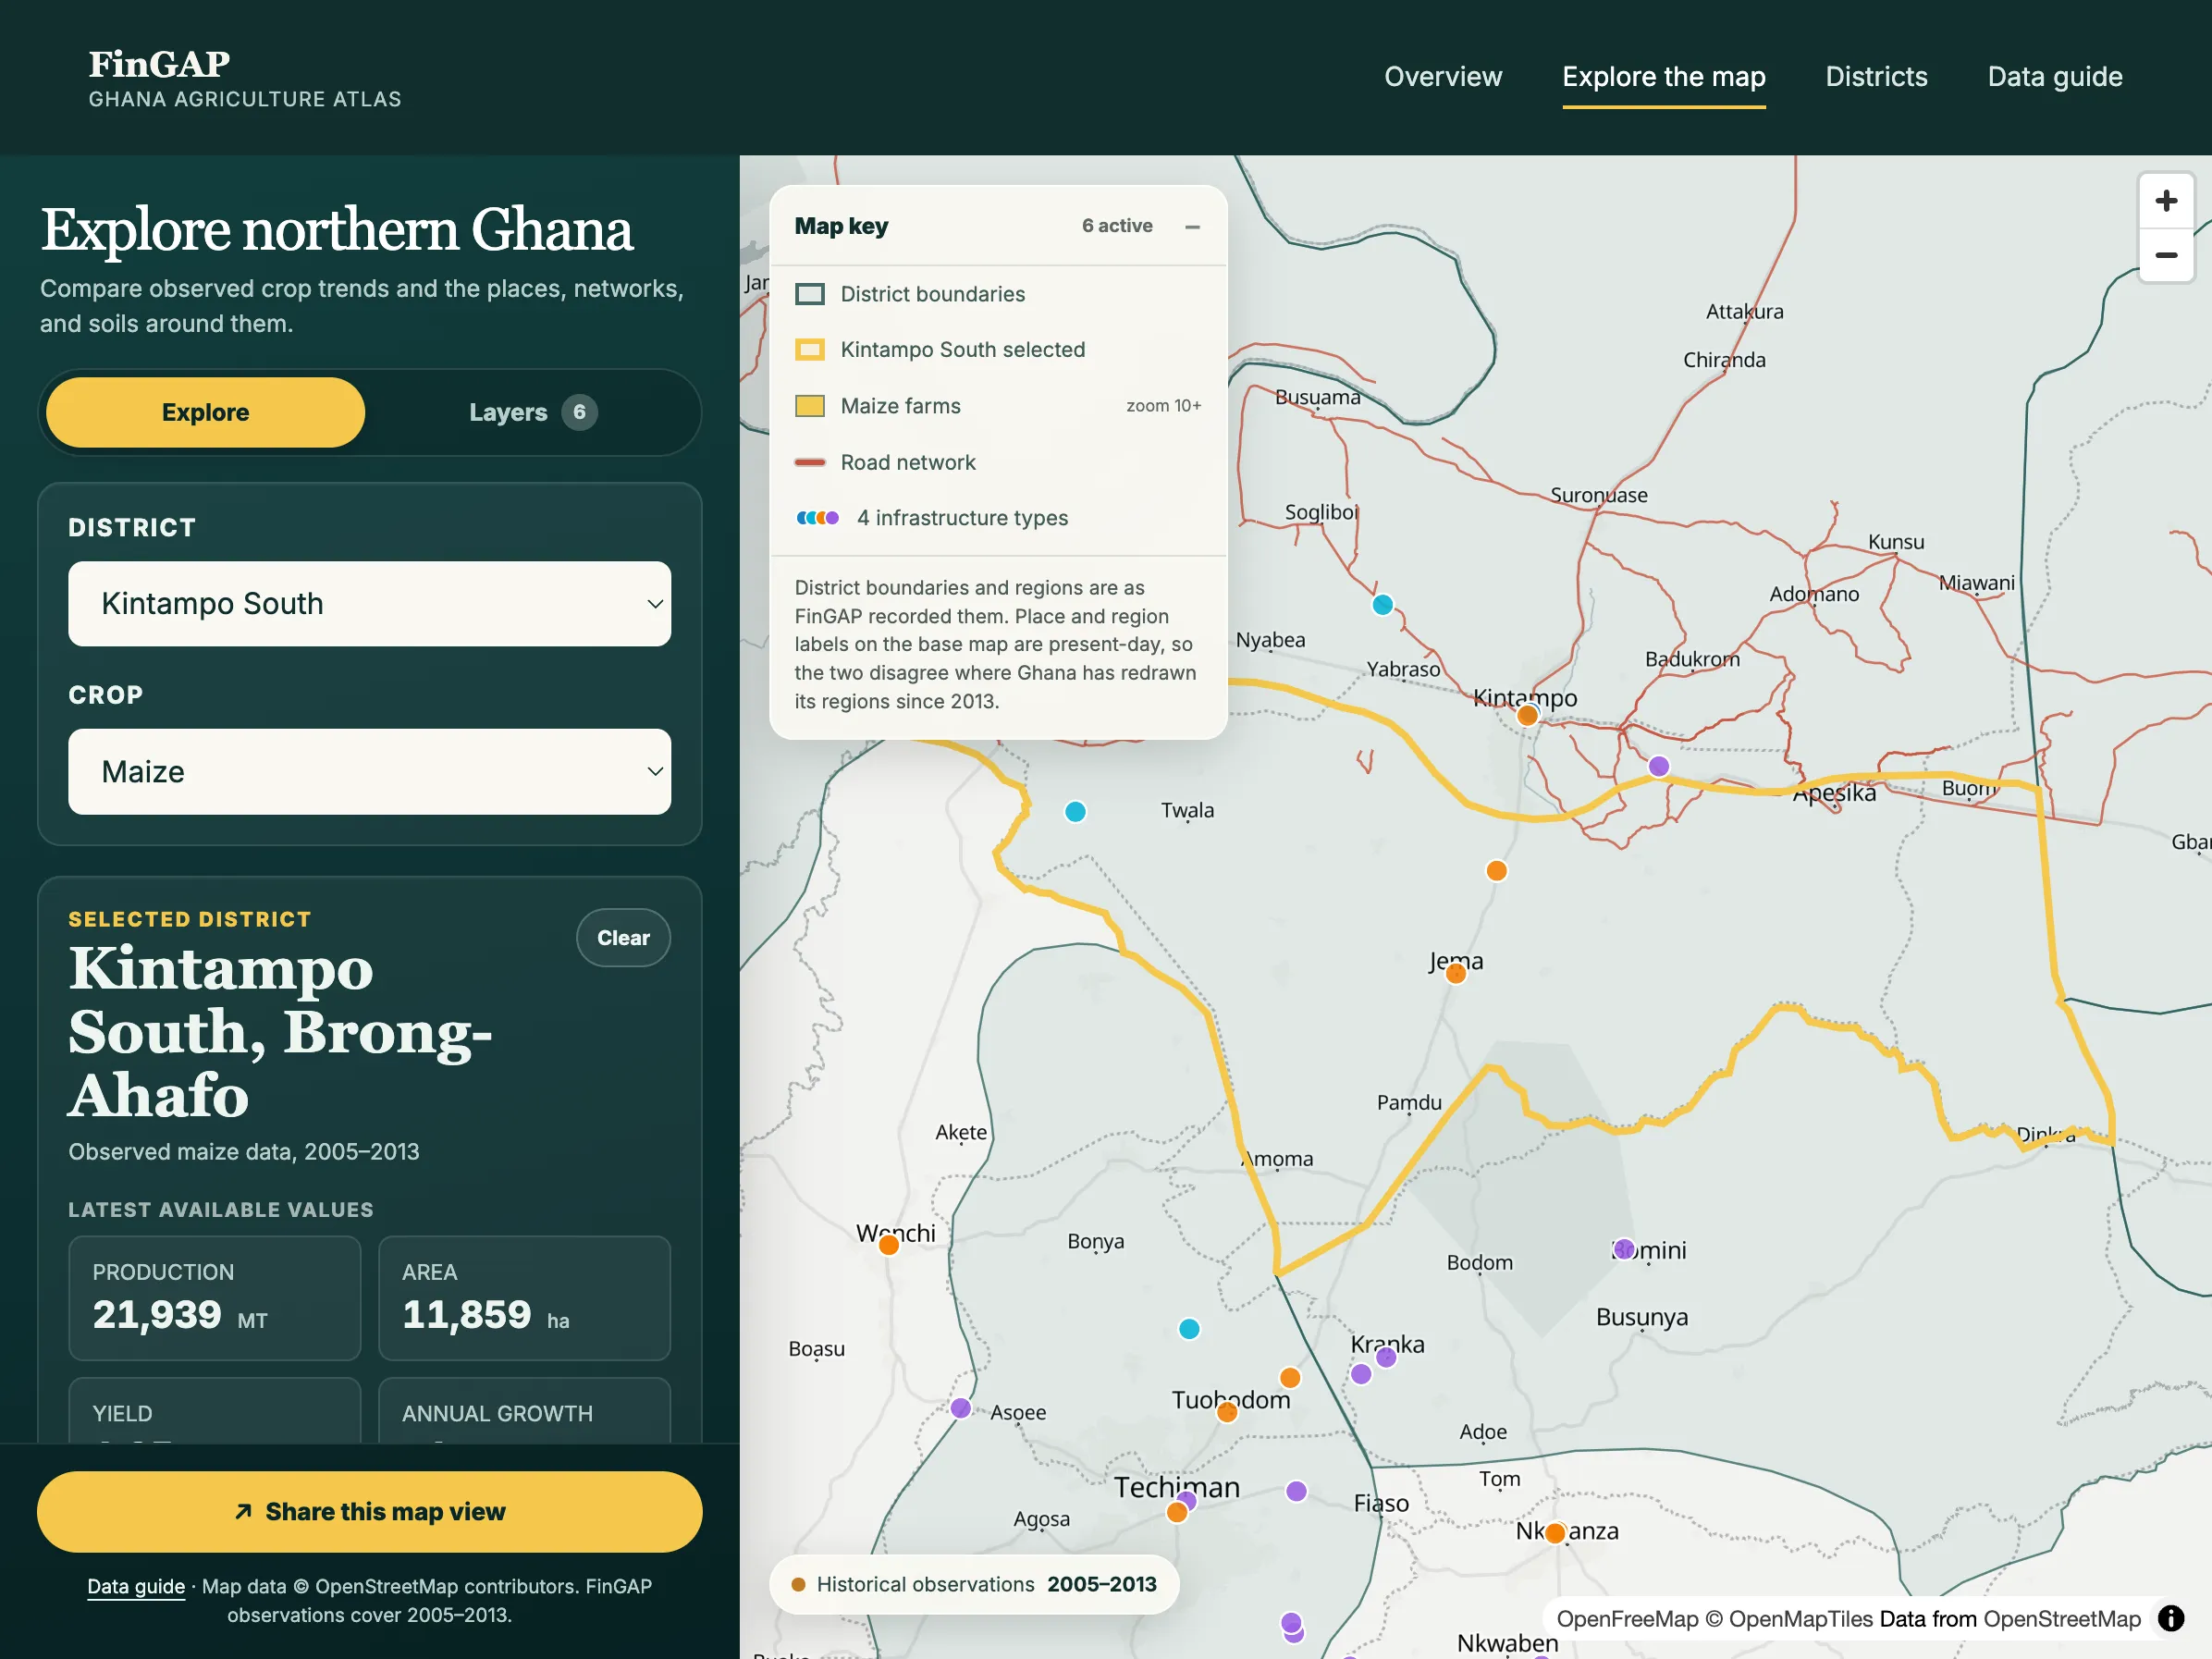
  • FinGAP explorer showing northern Ghana districts with Kintampo South selected and its observed maize production readout.

    FinGAP Ghana Agriculture Atlas

    The USAID Financing Ghanaian Agriculture Project's investment mapping system, rebuilt as a static atlas: 53 northern districts of observed crop production, archived farm geography, road networks, and soil classification on one MapLibre canvas.

    Agricultural development
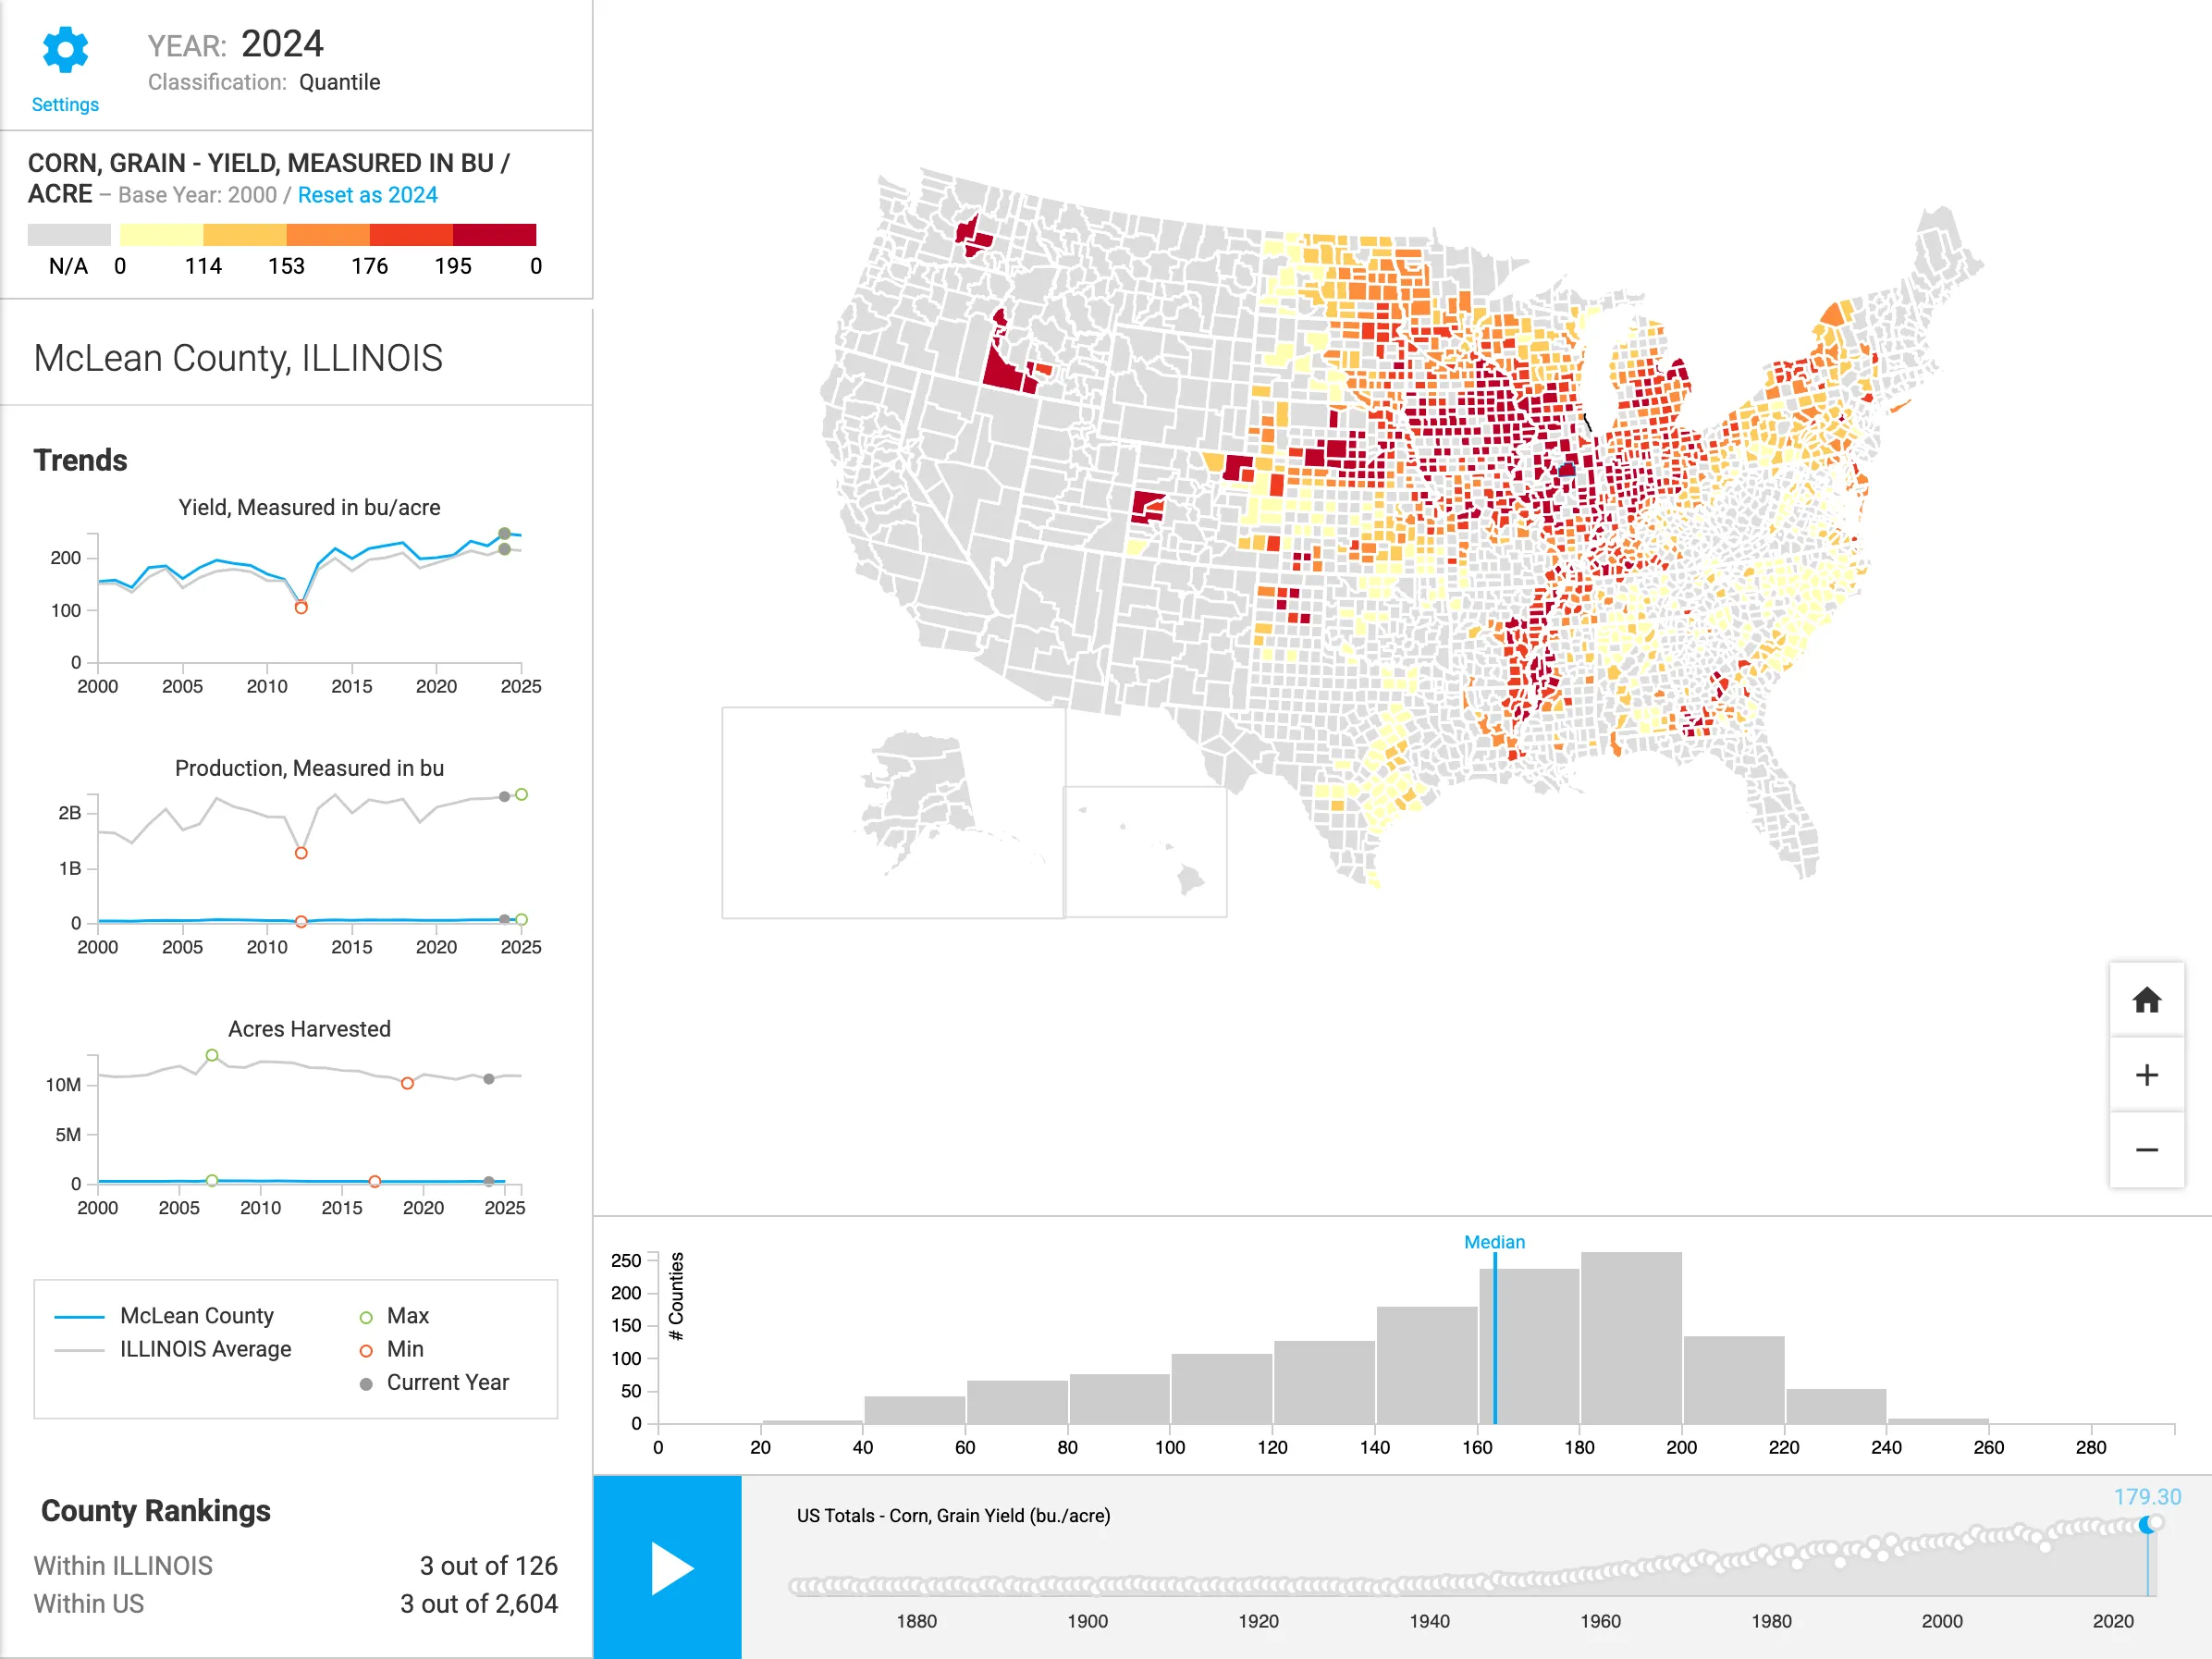
  • USDA NASS explorer with McLean County, Illinois selected, showing 2024 corn yield across U.S. counties beside its yield, production, and acreage trends.

    USDA NASS Explorer

    A county-level explorer for USDA QuickStats covering corn and soybean yield, production, and acreage, pairing a national choropleth with a distribution histogram and a full-history timeline that scrubs the map.

    Agriculture analytics
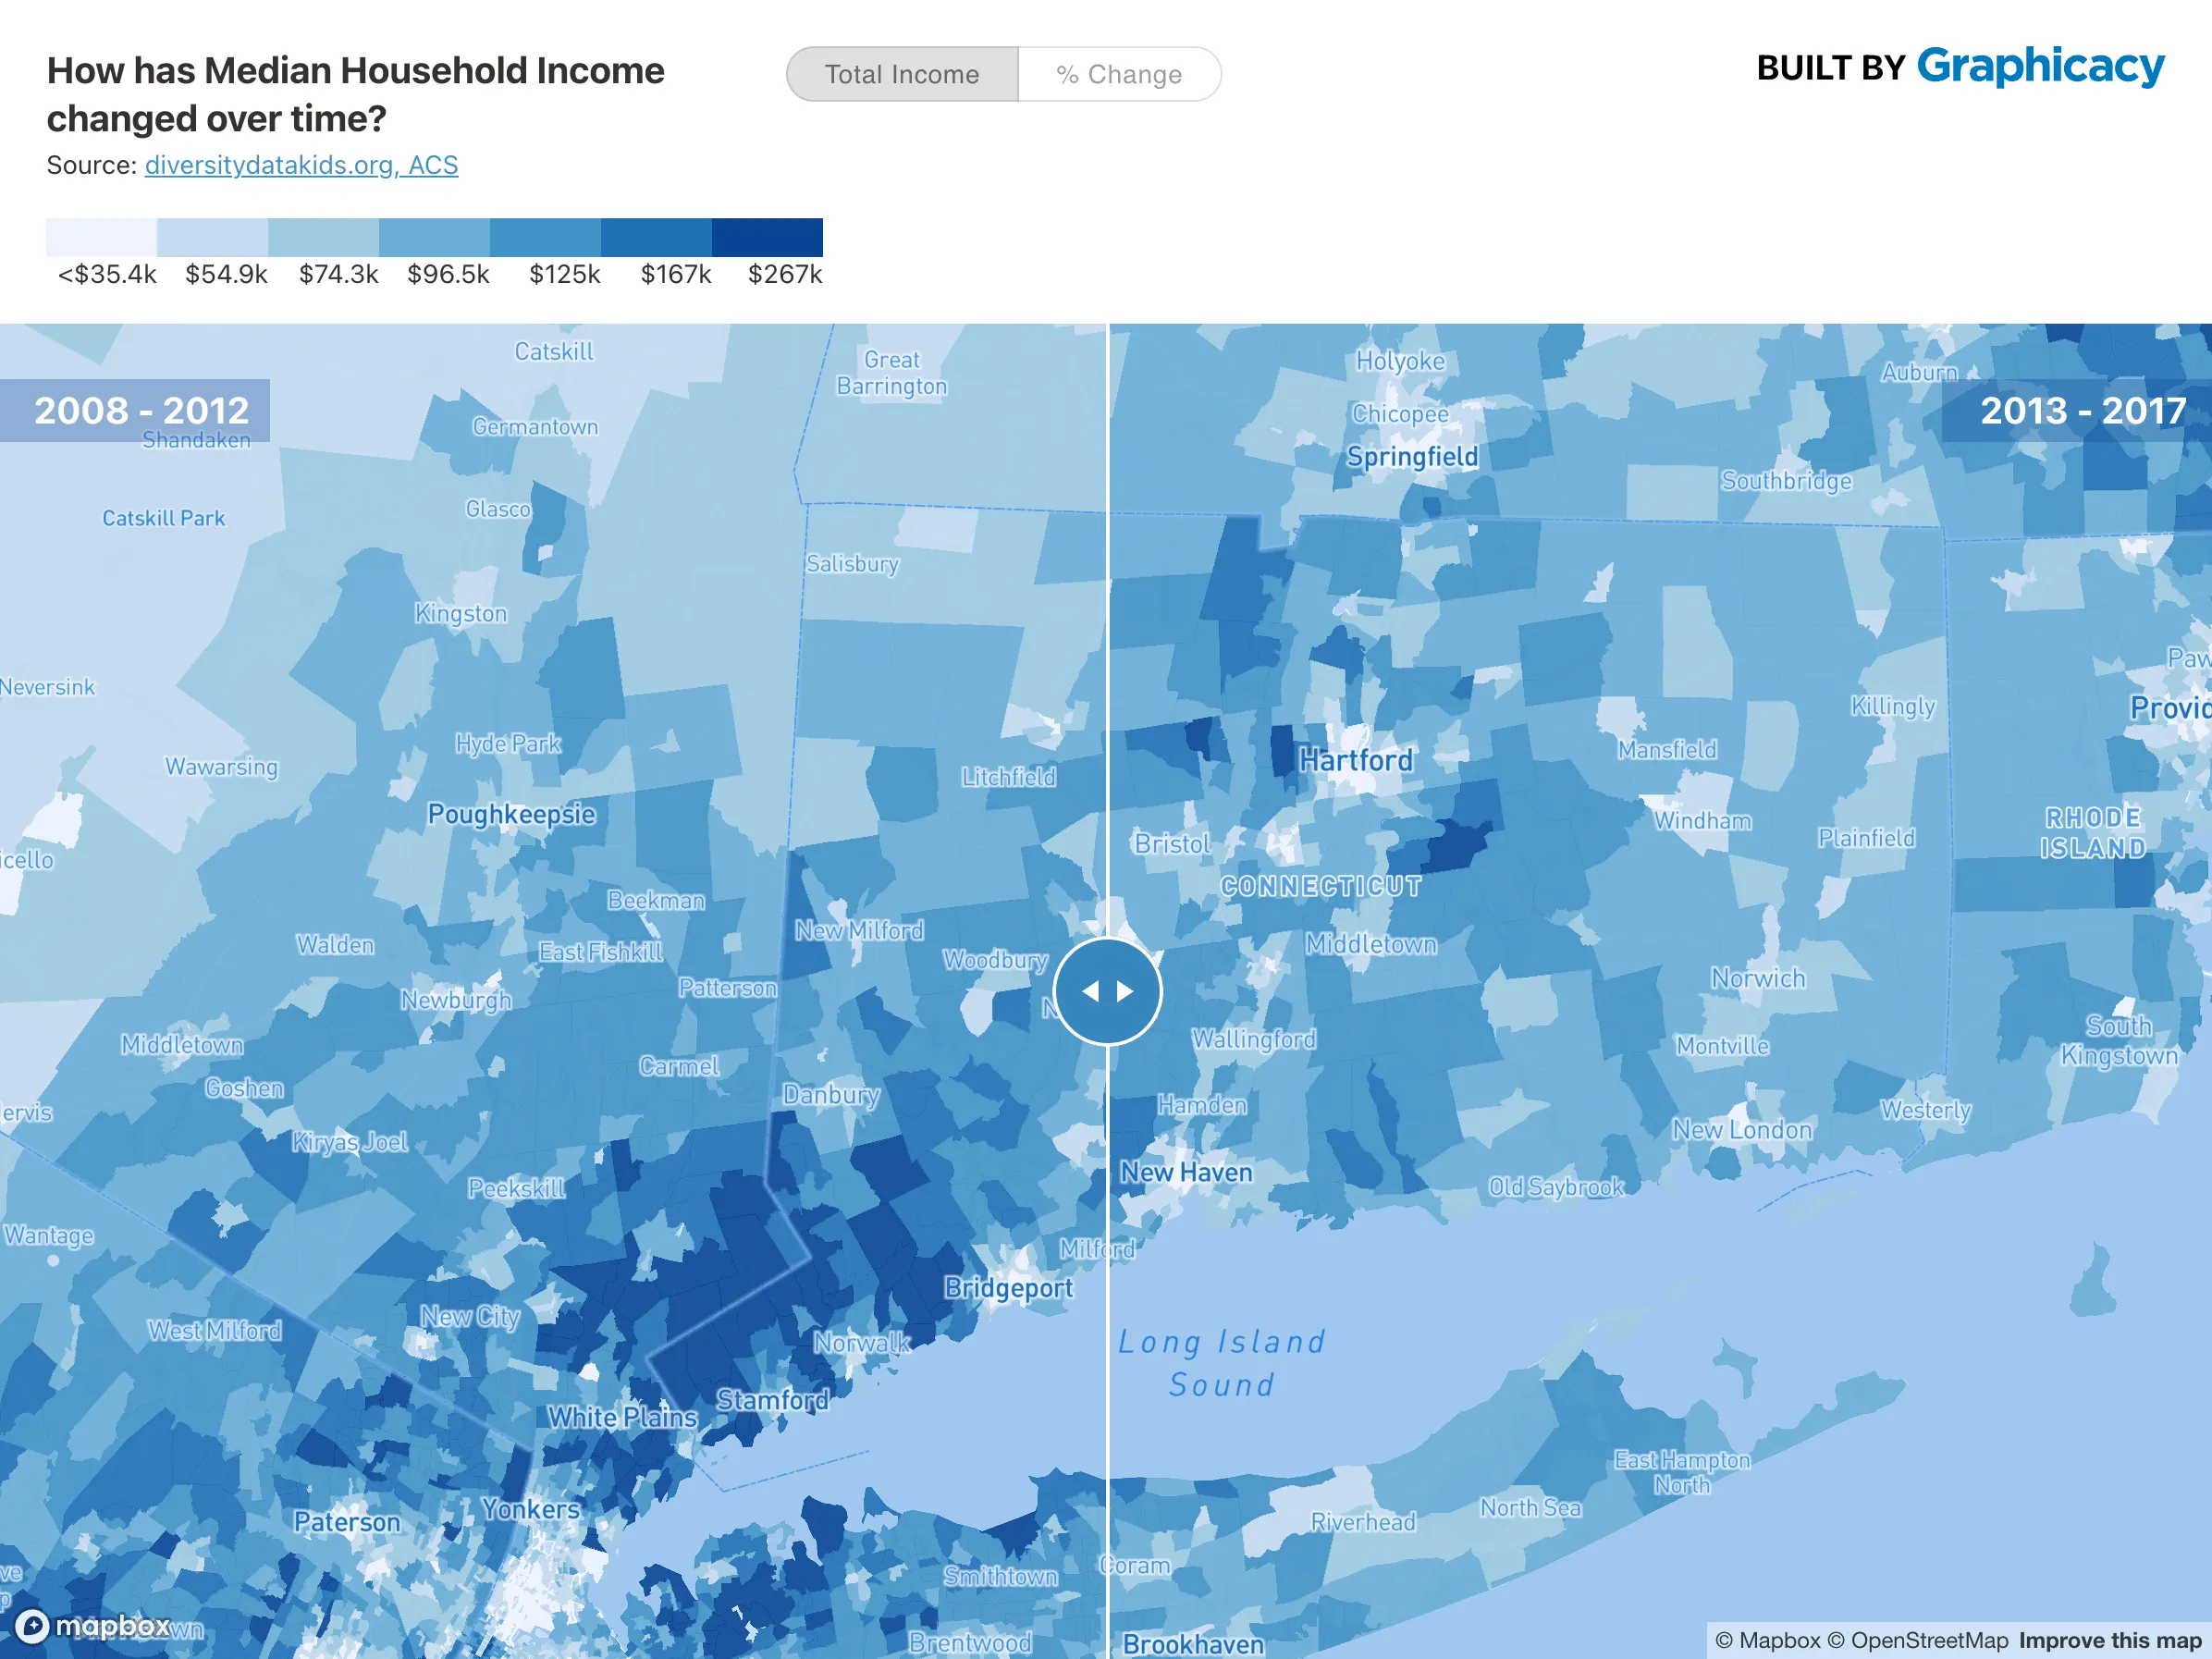
  • Side-by-side census tract choropleth comparing median household income between 2008–2012 and 2013–2017 with a slider divider.

    Census Income Compare

    A split-screen Mapbox GL map that sets two decades of American Community Survey median household income side by side, with a draggable divider for reading how income shifted tract by tract.

    Civic data View code
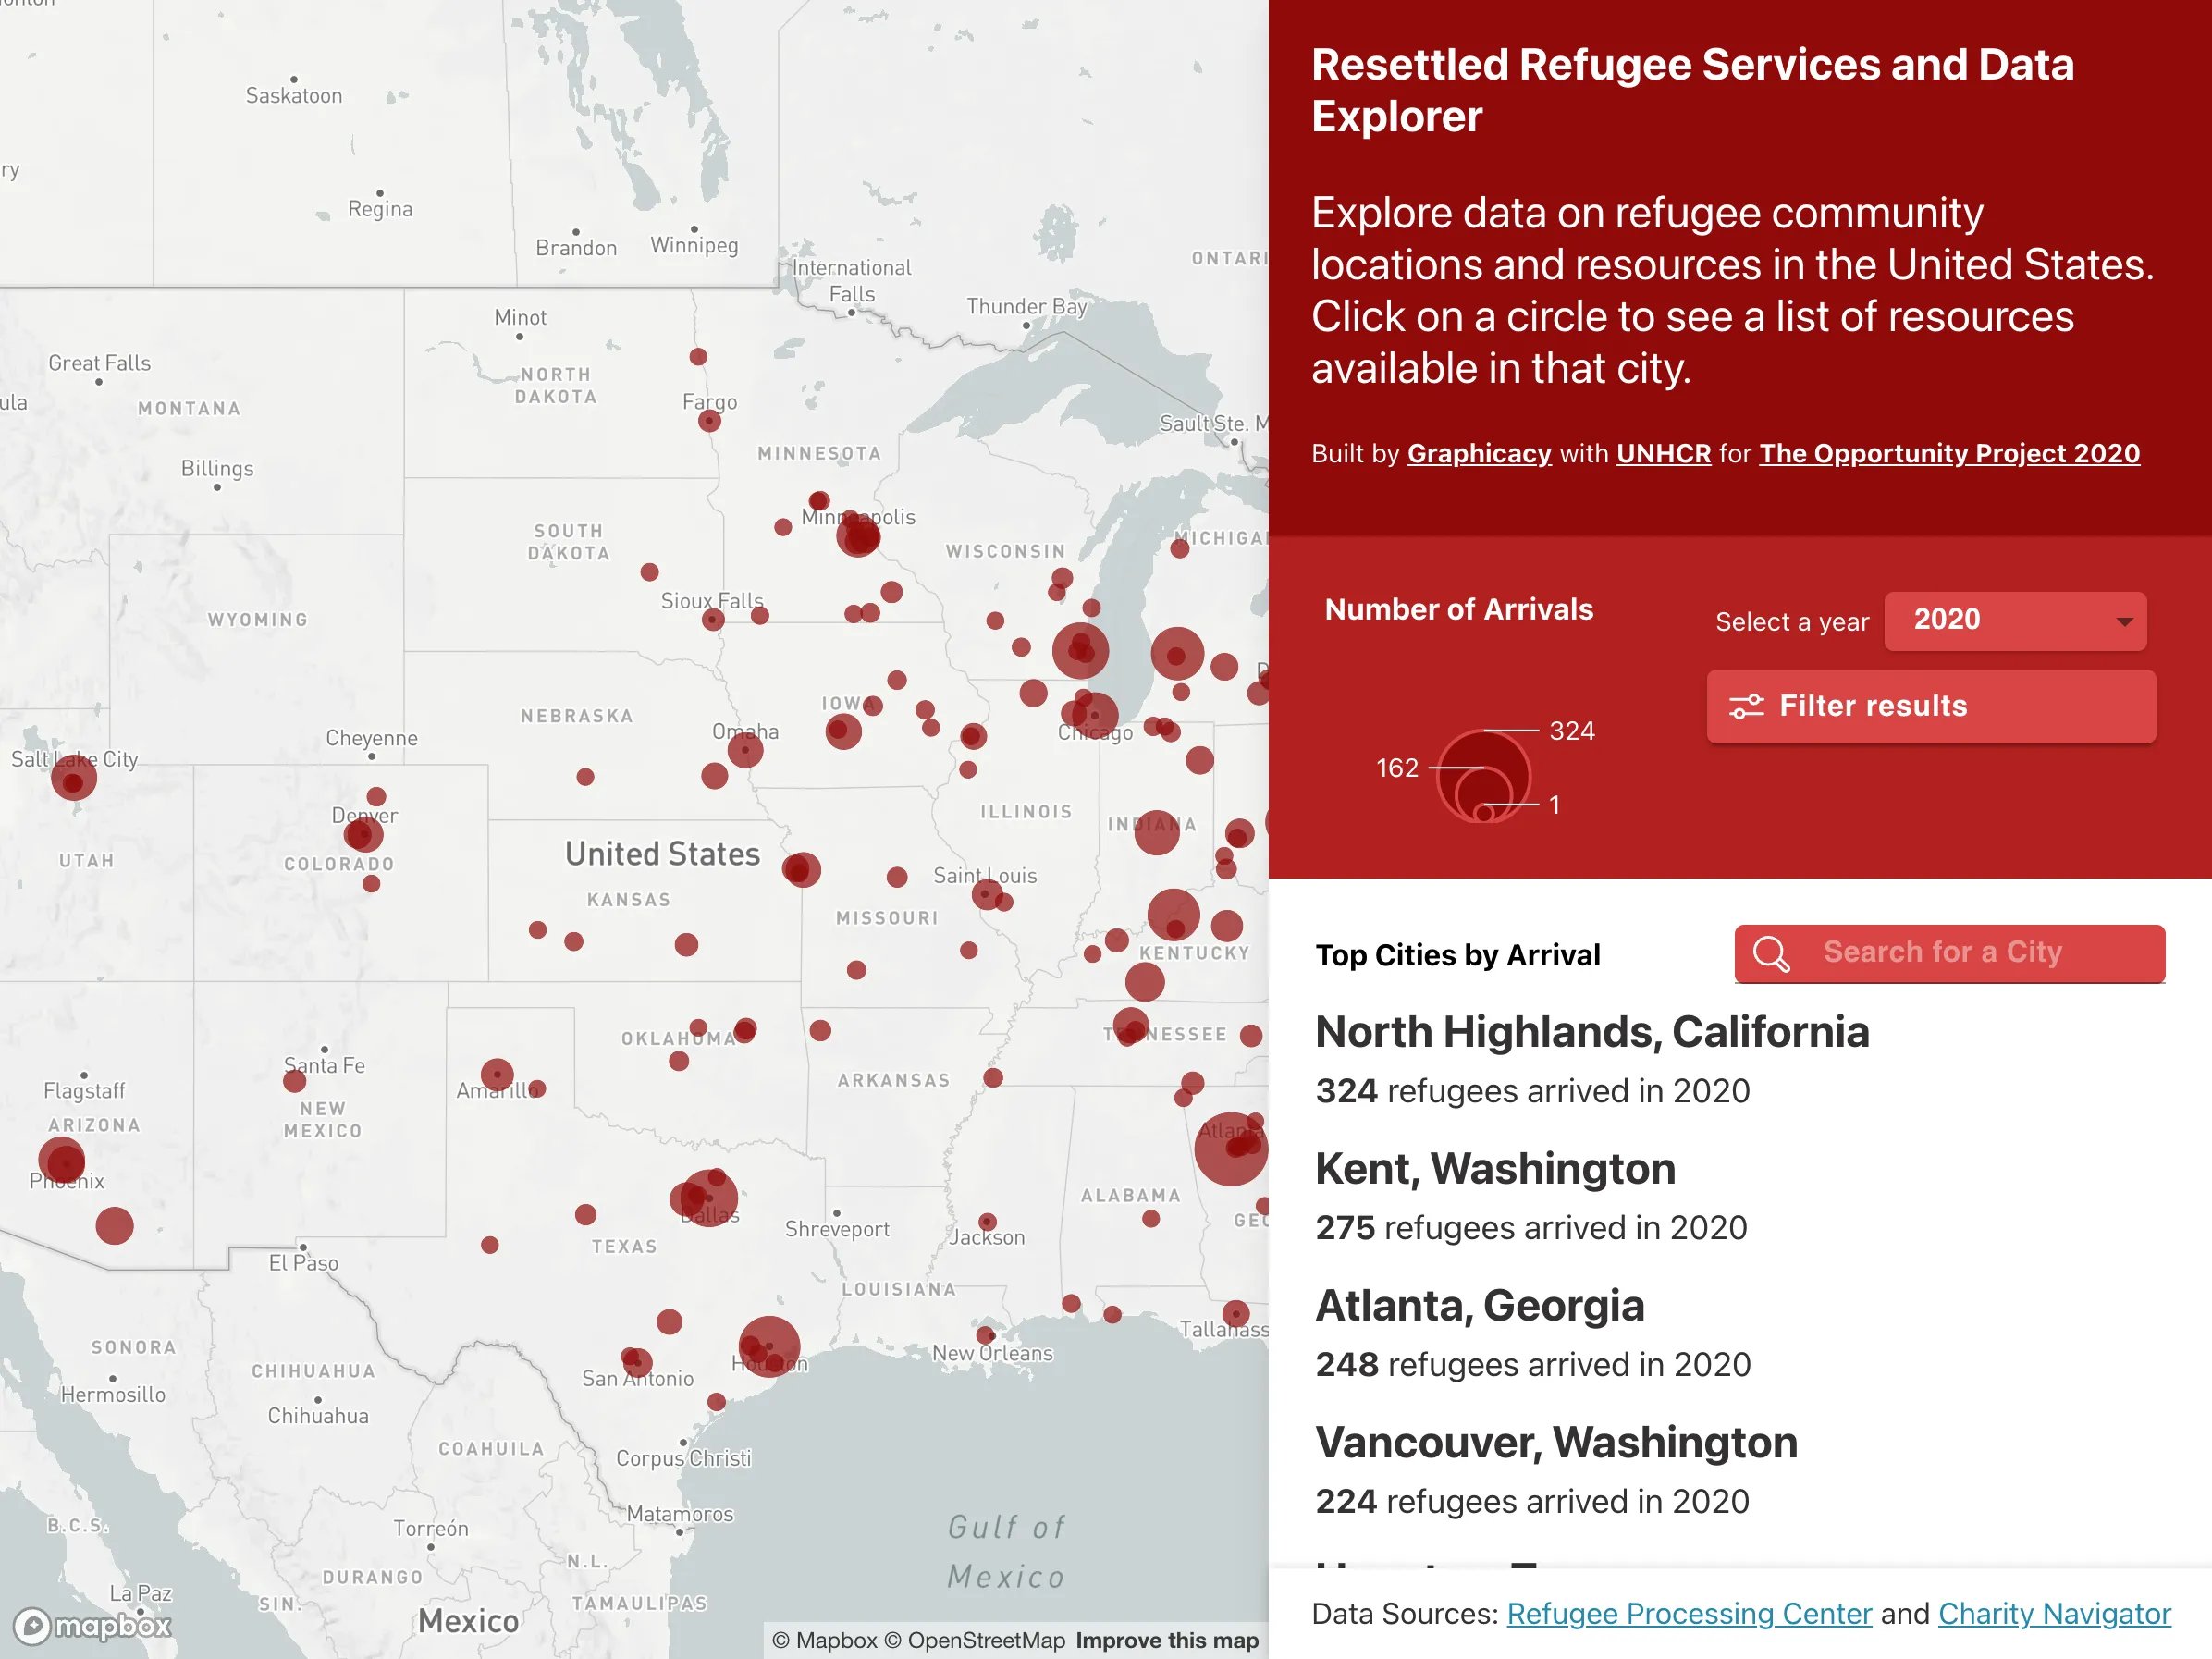
  • Proportional-symbol map of U.S. refugee resettlement with a panel listing top cities by arrivals.

    Resettled Refugee Services Explorer

    A Mapbox and D3 explorer, built with UNHCR for The Opportunity Project, mapping where resettled refugees were placed across U.S. cities over a decade and overlaying the charitable resources available nearby.

    Humanitarian data View code
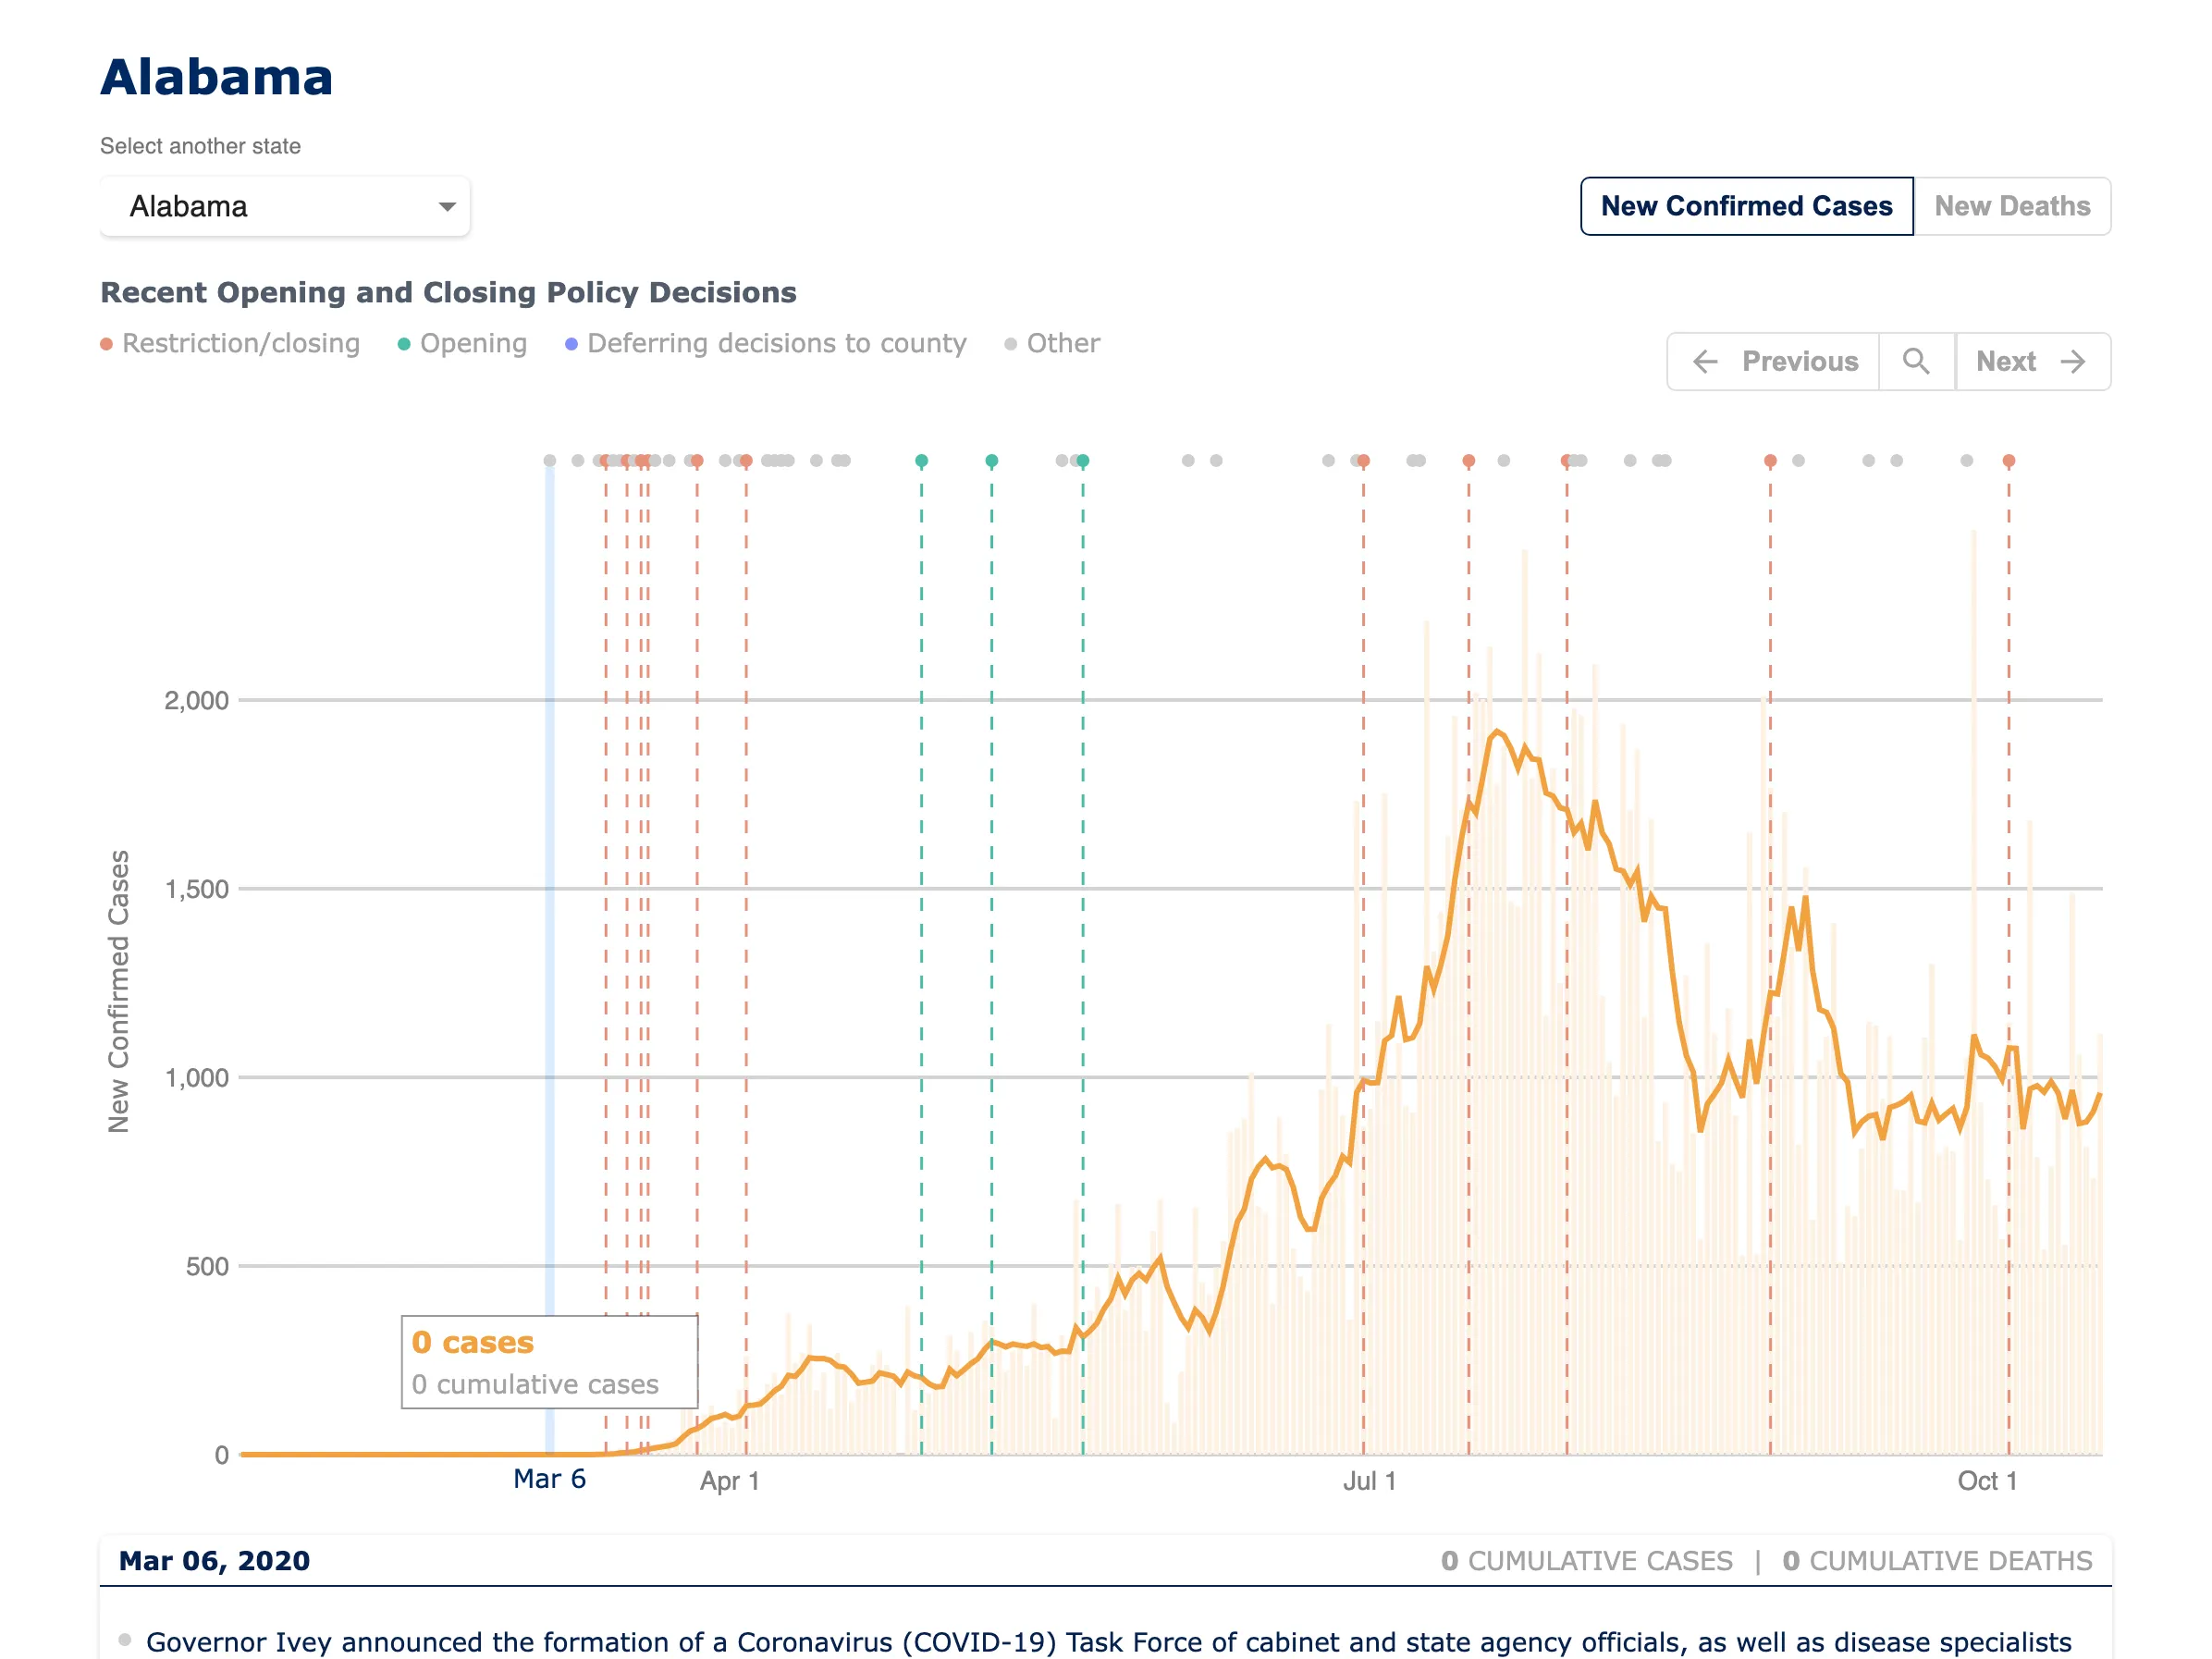
  • Timeline chart of Alabama's daily confirmed COVID-19 cases with dashed markers for state opening and closing policy decisions.

    State COVID Timeline

    A state-by-state timeline that sets daily case and death curves against the opening and closing orders that bracketed them, so each policy decision can be read against what actually followed it.

    Public health
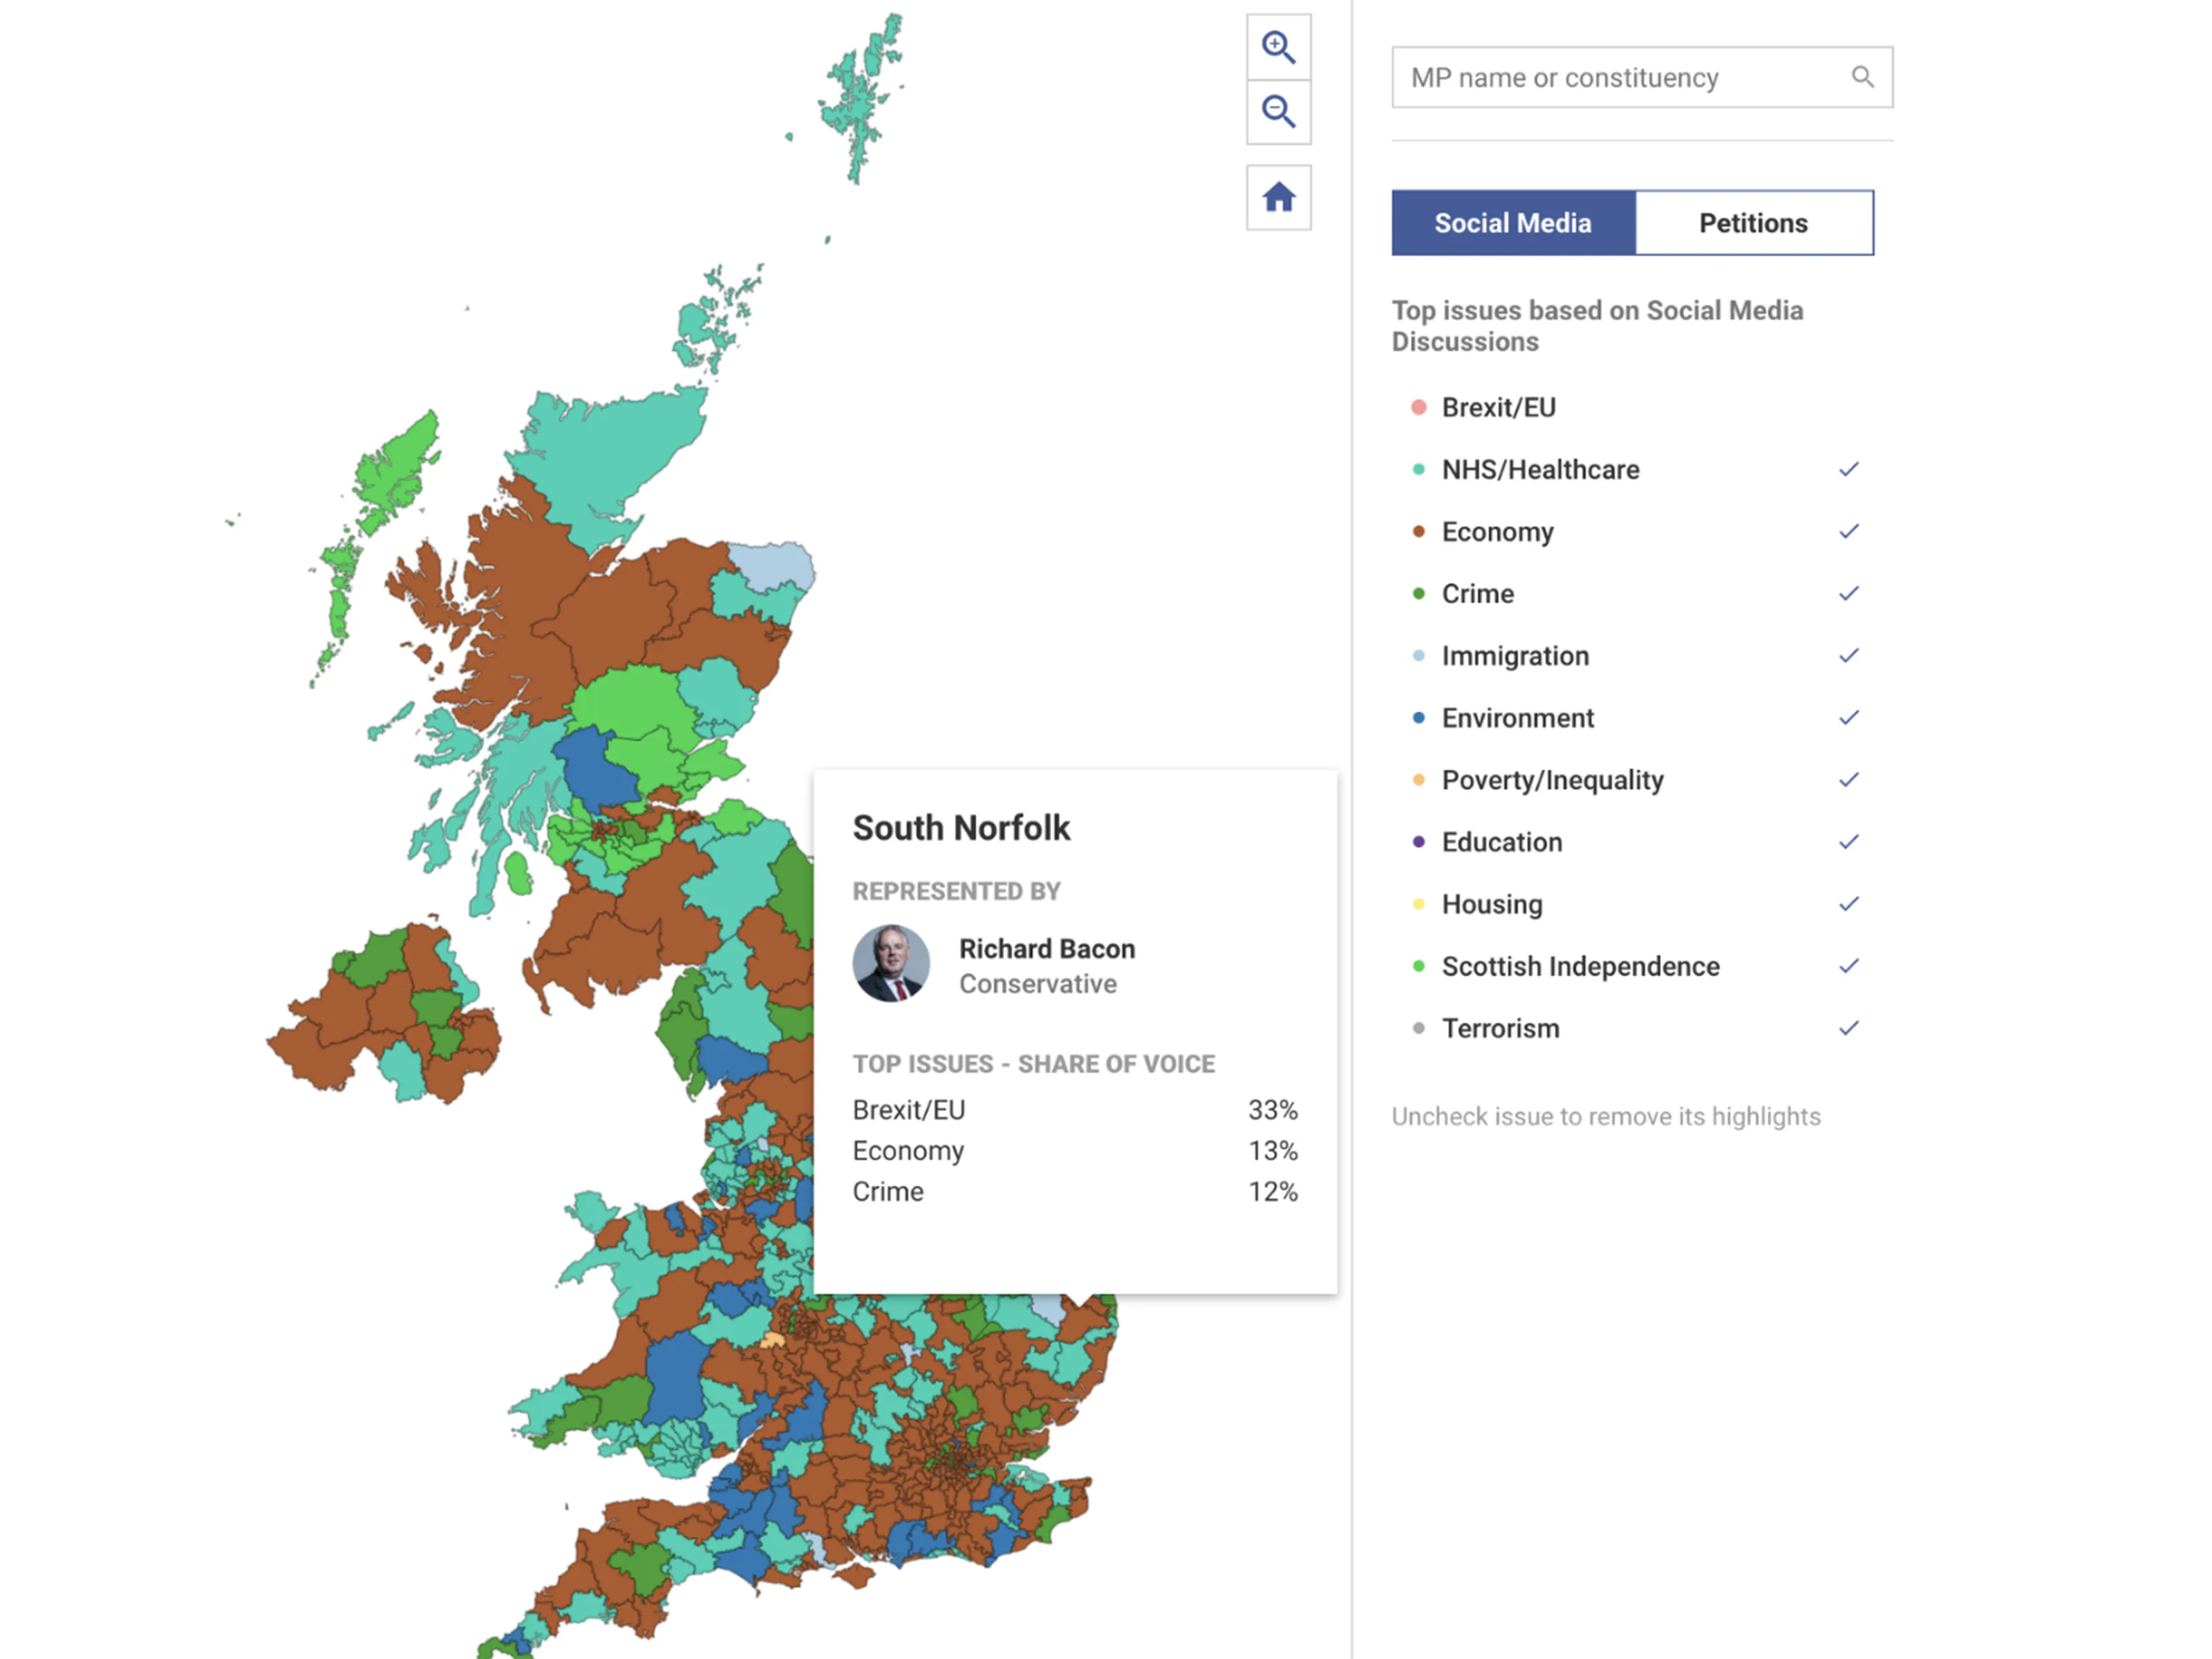
  • Interactive map of UK constituencies with political issue filters and representative detail.

    UK Political Atlas

    A constituency-level product that translates fragmented political signals into a clear map, filter system, and representative view.

    Civic data
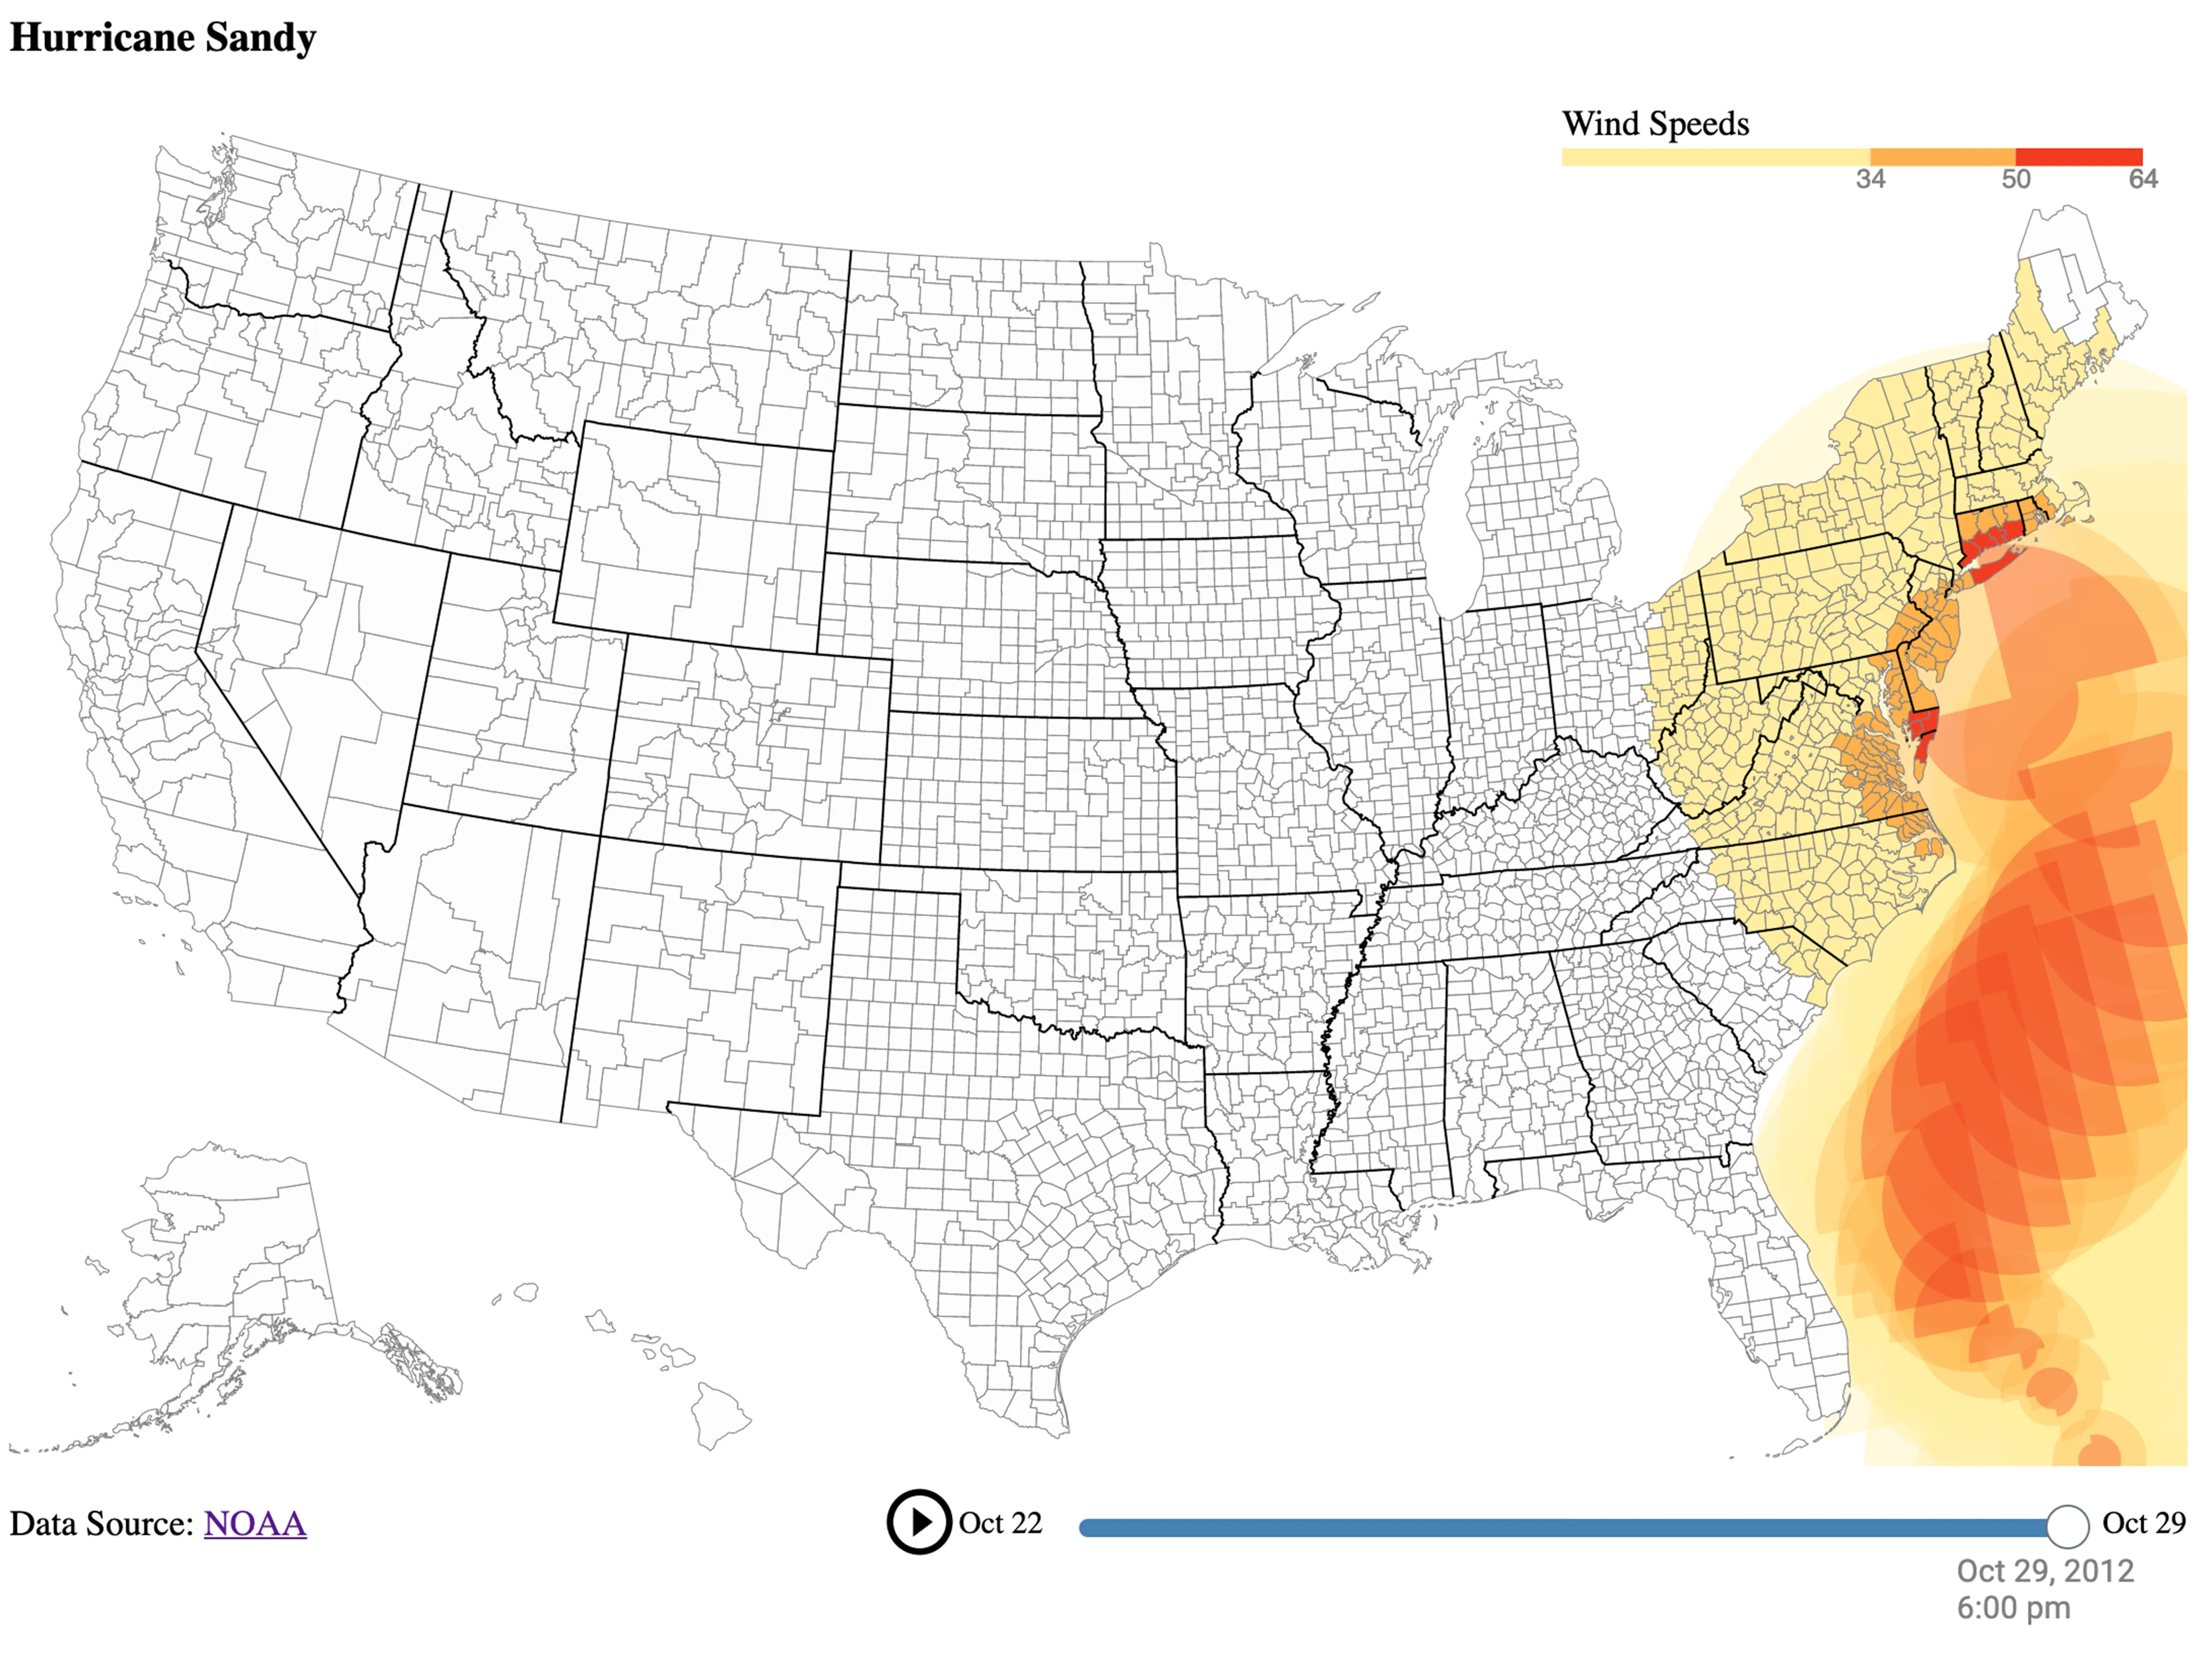
  • Map-based hurricane visualization showing wind-speed gradients and a temporal scrubber.

    Hurricane Sandy Analysis

    A weather analysis prototype combining time, geography, and storm intensity in one view to support rapid pattern recognition.

    Climate and risk

Where the work was done, and who it was done for.

A regulated lender, a global data-collection platform, a bespoke visualization firm, and a studio of my own. In each one the scope arrived from the people who would use the result.

Full history on LinkedIn
  1. Mission Lane

    2022 – present

    Sr. Principal Engineer · Regulated consumer fintech

    Front-end architecture for a consumer credit product, across web and React Native. Principal from 2022, senior principal from 2026.

  2. Nautilytics

    Ongoing

    Founder, product studio · Data products and AI apps

    Own studio shipping end to end: TradeNet, the USAID FinGAP atlas, the USDA NASS explorer, and two App Store products with live model telemetry.

  3. The Impending Bloom Project

    2026 – present

    Advisor · Nonprofit

    Technical advising on architecture and delivery for a small nonprofit engineering effort.

  4. Premise Data

    2021 – 2022

    Staff Frontend Engineer · Global data collection

    Architected and implemented an organization-wide design system and component library in React, on Material UI and Base Web, plus the tooling and deployment process around it.

  5. Graphicacy

    Data Visualization Engineer · Mission-driven client work

    Bespoke visualization delivered directly to clients: UNHCR resettlement mapping for The Opportunity Project, census income comparison, and the UK Political Atlas, built alongside award-winning information designers.

Technique write-ups.

Visualization internals, design systems, and testing practice, written the way a deployment write-up is written: what was built, what it cost, and where it would break next.

Visit Medium

Three granted US patents.

Reservation workflow, VR behavioral analytics, and hierarchical visualization, each prosecuted through examination to grant.

US 10,860,954

Roomfinder Platform

A mobile reservation workflow that uses OCR to identify a conference room, surface its live schedule, and book the room or suggest nearby alternatives when it is unavailable.

View patent

US 10,747,760

Method and System for Tracking Virtual Reality Experiences

A visualization and analytics system for VR experiences that captures user movement and position data, then turns those signals into heat maps and reviewable behavioral patterns.

View patent

US 10,482,130

Three-dimensional Tree Diagrams

A method for rendering hierarchical data as three-dimensional tree diagrams by positioning nodes and edges with structural constraints to improve readability and analytical exploration.

View patent

Let's talk about the deployment.

Send the role, or send the problem that keeps stalling. I am glad to walk through the PlateQuest evaluation in detail, including the parts that did not work.

Start a conversation